
Topic: Electromagnetic radiation, photoelectric effect, hydrogen spectrum· Atomic Structure
Choose the correct option for graphical representation of Boyle's law, which shows a graph of pressure vs. volume of a gas at different temperatures :
Choose the correct option for graphical representation of Boyle's law, which shows a graph of pressure vs. volume of a gas at different temperatures :
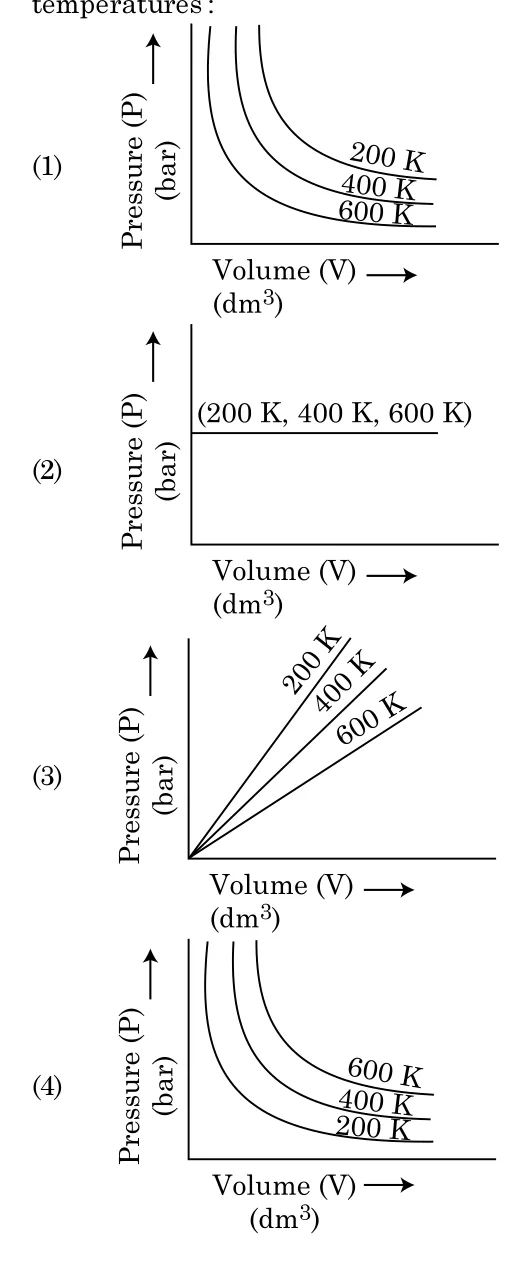
1. [graph option - see figure]
2. [graph option - see figure]
3. [graph option - see figure]
4. [graph option - see figure]