
Topic: Integrated rate equations and half-life (zero and first order)· Chemical Kinetics
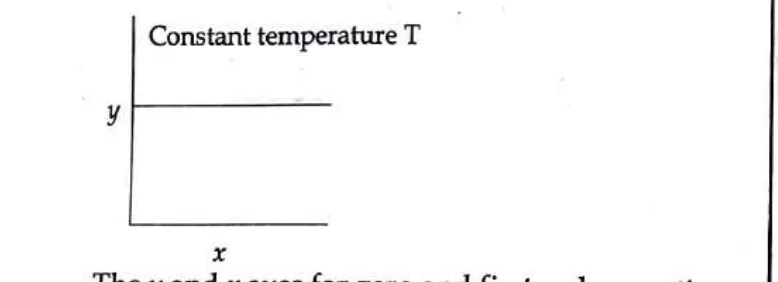
The given graph is a representation of kinetics of a reaction.[Graph: y versus x at constant temperature T]The y and x axes for zero and first order reactions, respectively are
The given graph is a representation of kinetics of a reaction.
[Graph: y versus x at constant temperature T]
The \(y\) and \(x\) axes for zero and first order reactions, respectively are
1. zero order (\(y\) = rate and \(x\) = concentration), first order (\(y\) = rate and \(x\) = \(t_{1/2}\))
2. zero order (\(y\) = concentration and \(x\) = time), first order (\(y\) = \(t_{1/2}\) and \(x\) = concentration)
3. zero order (\(y\) = concentration and \(x\) = time), first order (\(y\) = rate constant and \(x\) = concentration)
4. zero order (\(y\) = rate and \(x\) = concentration), first order (\(y\) = \(t_{1/2}\) and \(x\) = concenration)