Skip to content
doubtly
Topic: Position-time and velocity-time graphs· Kinematics

The velocity (v) - time (t) plot of the motion of a body is shown below :The acceleration (a) - time (t) graph that best suits this motion is :

The velocity (\(v\)) - time (\(t\)) plot of the motion of a body is shown below :

The acceleration (\(a\)) - time (\(t\)) graph that best suits this motion is :
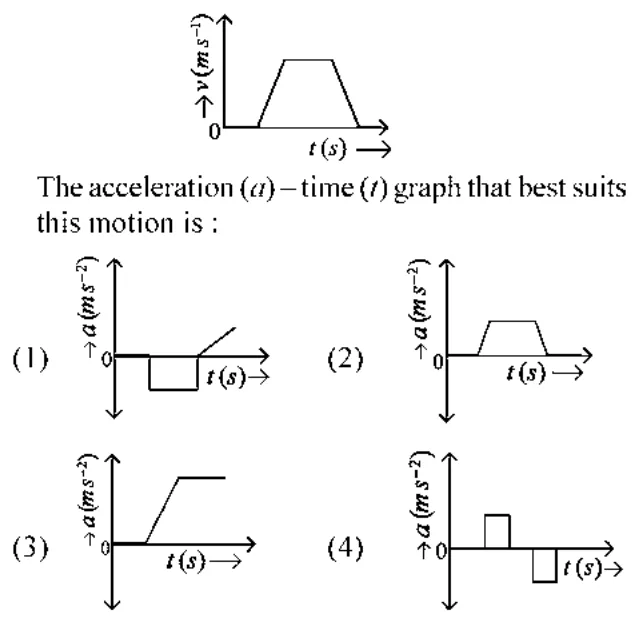
v-t trapezoid graph and four a-t graph options

1. graph (1)

2. graph (2)

3. graph (3)

4. graph (4)

1 answer

Best answer

Answer: 4. graph (4)

Key idea: Acceleration is the slope of the \(v\)-\(t\) graph.

  1. Initially \(v=0\) and flat: \(a=0\).
  2. Straight rise: constant positive \(a\).
  3. Flat top: \(a=0\).
  4. Straight fall: constant negative \(a\) (of the same size, as the slopes are equal in size).
  5. Flat at the end: \(a=0\).

This is a positive rectangular pulse, then zero, then a negative pulse: graph (4).

Doubtly AI · 30 Oct 2026 AI-generated · not yet verified Report
Was this answer helpful?

Your answer

Log in or create a free account to answer this question.