
Topic: Matter waves, de Broglie relation· Dual Nature of Matter and Radiation
The graph which shows the variation of the de Broglie wavelength (λ) of a particle and its associated momentum (p) is :
The graph which shows the variation of the de Broglie wavelength (\(\lambda\)) of a particle and its associated momentum (p) is :
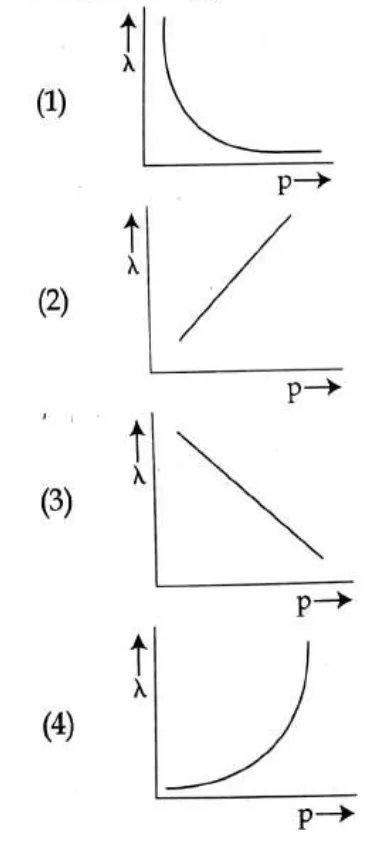
1. (graph)
2. (graph)
3. (graph)
4. (graph)