Skip to content
doubtly
Topic: Matter waves, de Broglie relation· Dual Nature of Matter and Radiation

The graph which shows the variation of ≤ft(1/λ^2) and its kinetic energy, E is (where λ is de Broglie wavelength of a free particle) :

The graph which shows the variation of \(\left(\frac{1}{\lambda^2}\right)\) and its kinetic energy, \(E\) is (where \(\lambda\) is de Broglie wavelength of a free particle) :
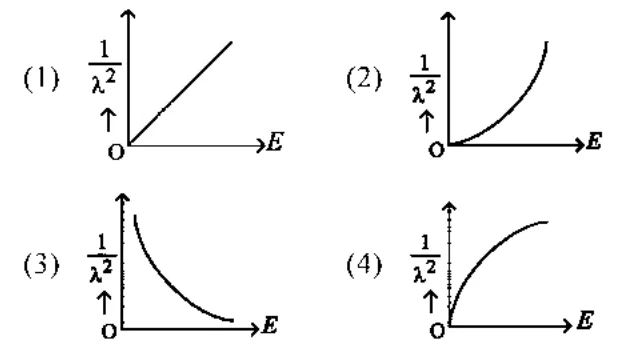
four graphs of 1/lambda^2 vs E (options)

1. graph (1)

2. graph (2)

3. graph (3)

4. graph (4)

1 answer

Best answer

Answer: 1. graph (1)

Key idea: For a free particle \(E=\frac{p^2}{2m}\) and \(\lambda=\frac hp\).

So \(E=\frac{h^2}{2m\lambda^2}\), which gives \(\frac1{\lambda^2}=\frac{2m}{h^2}E\).

\(\frac1{\lambda^2}\) is directly proportional to \(E\), so the graph is a straight line through the origin: graph (1). Graph (2) is a parabola, (3) is a falling curve and (4) is a rising curve that bends over, none of which is linear.

Doubtly AI · 30 Oct 2026 AI-generated · not yet verified Report
Was this answer helpful?

Your answer

Log in or create a free account to answer this question.