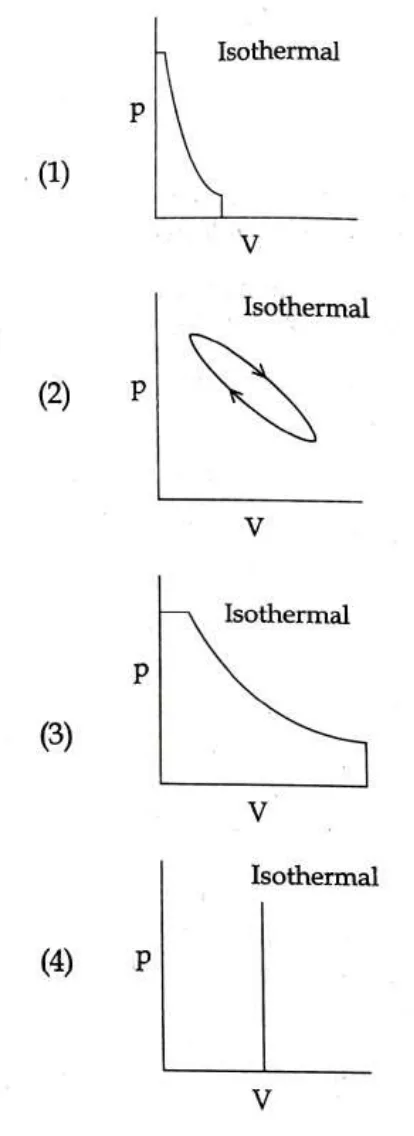
Which of the following p-V curve represents maximum work done ?
1. [graph in figure]
2. [graph in figure]
3. [graph in figure]
4. [graph in figure]
Which of the following p-V curve represents maximum work done ?

1. [graph in figure]
2. [graph in figure]
3. [graph in figure]
4. [graph in figure]
Best answer
Answer: 3. [graph in figure]
Key idea: work done by the gas equals the area under the p-V curve, so find the graph with the largest area.
Graph (3) shows a constant-pressure expansion at the highest pressure followed by an isothermal expansion over a long volume range, down to a low final pressure. Its area is the largest. Graph (1) has a small volume change, graph (2) is a closed loop with only small net work, and graph (4) is a vertical line (no volume change, zero work).
Log in or create a free account to answer this question.