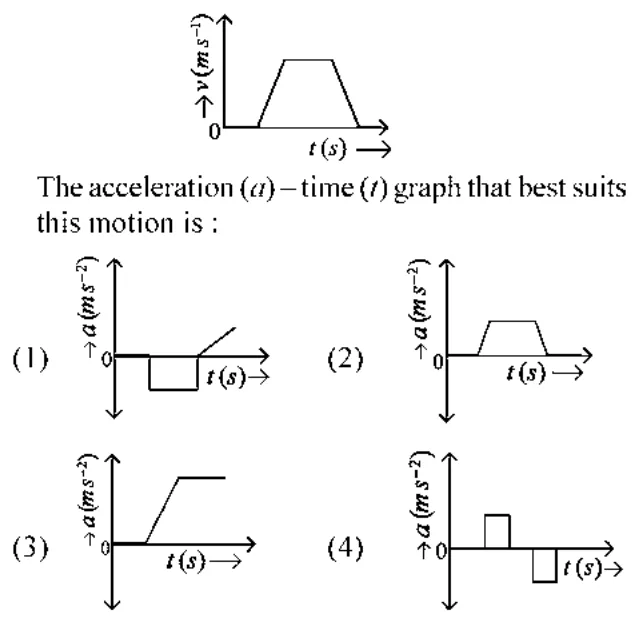
The velocity (\(v\)) - time (\(t\)) plot of the motion of a body is shown below :
The acceleration (\(a\)) - time (\(t\)) graph that best suits this motion is :
Every question from past board papers on Position-time and velocity-time graphs, newest paper first. Open any question for its full worked answer.
The velocity (\(v\)) - time (\(t\)) plot of the motion of a body is shown below :
The acceleration (\(a\)) - time (\(t\)) graph that best suits this motion is :
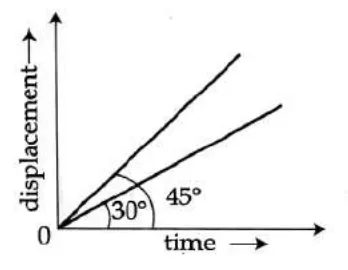
The displacement-time graphs of two moving particles make angles of \(30°\) and \(45°\) with the x-axis as shown in the figure. The ratio of their respective velocity is :