
Topic: Resistivity, conductivity and temperature dependence of resistance· Current Electricity
Which of the following graph represents the variation of resistivity (ρ) with temperature (T) for copper ?
Which of the following graph represents the variation of resistivity (\(\rho\)) with temperature (T) for copper ?
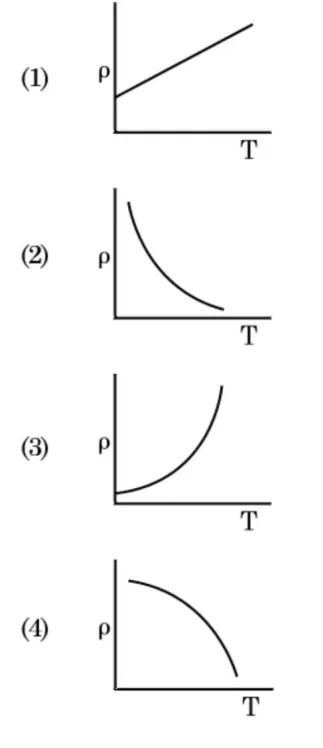
1. graph (1)
2. graph (2)
3. graph (3)
4. graph (4)