Table of Contents
DatawareHouse & Mining Question paper Solutions (AI-DS/AI-ML/CSE(DS/AIML)) 2022
Q. 1
(a) Explain features of data warehouse.
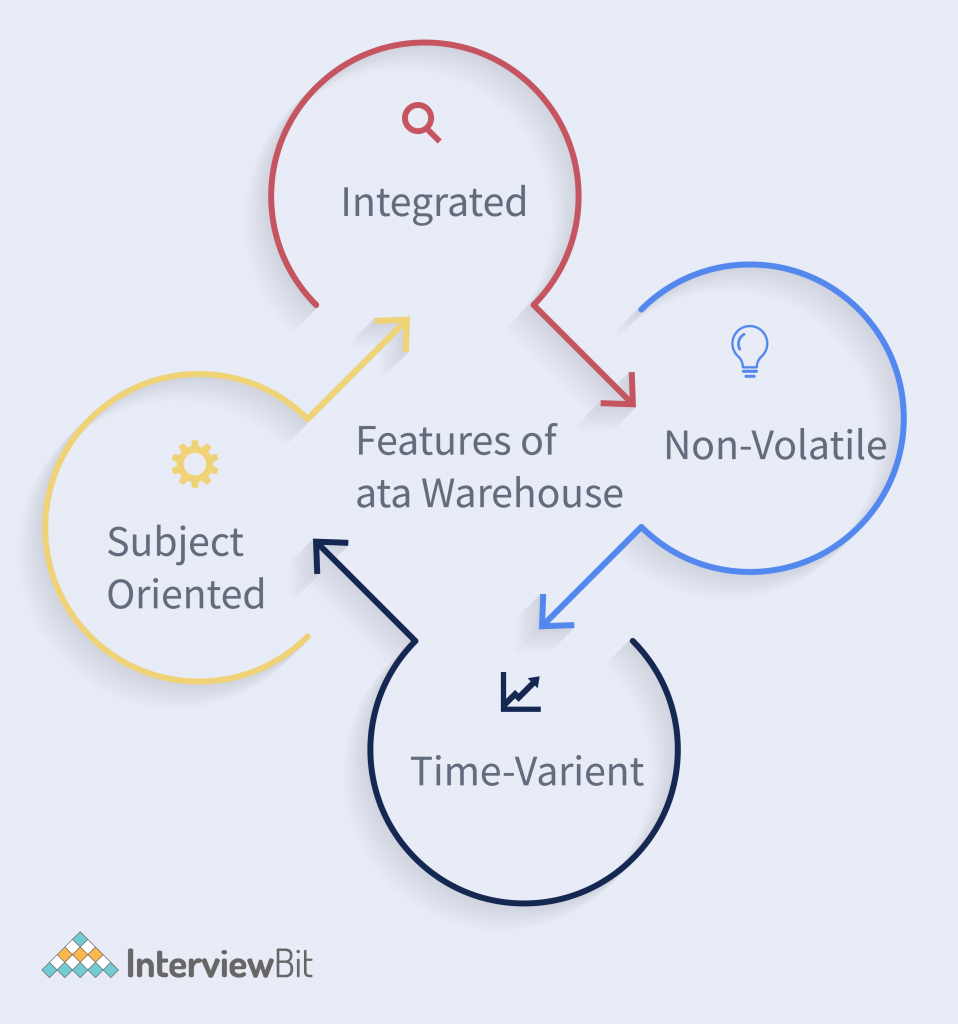
- Integrated: Data warehouses integrate data from various sources across the organization, ensuring a unified and consistent view.
- Subject-Oriented: They are designed to store and retrieve data related to specific business subjects or themes, such as sales, finance, or customer relationships.
- Time-Variant: Data warehouses maintain historical data, allowing for the analysis of changes and trends over time.
- Non-Volatile: Once data is loaded into the warehouse, it is typically not modified, providing a stable and reliable data environment.
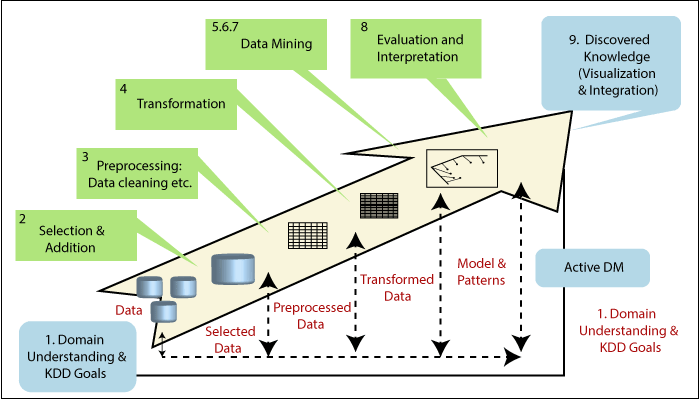
(b) Demonstrate with diagram the process of KDD.
The term KDD stands for Knowledge Discovery in Databases. It refers to the broad procedure of discovering knowledge in data and emphasizes the high-level applications of specific Data Mining techniques. It is a field of interest to researchers in various fields, including artificial intelligence, machine learning, pattern recognition, databases, statistics, knowledge acquisition for expert systems, and data visualization.
- Understanding the Application Domain:
- Define goals and objectives of KDD.
- Understand end-user needs and the environment.
- Choosing and Creating a Data Set:
- Determine relevant data for KDD.
- Integrate data from various sources for analysis.
- Preprocessing and Cleansing:
- Improve data reliability.
- Handle missing values, noise, and outliers.
- Data Transformation:
- Prepare data for Data Mining.
- Include dimension reduction and attribute transformation.
- Prediction and Description:
- Decide on Data Mining techniques based on objectives.
- Choose between prediction (supervised) and description (unsupervised).
- Selecting the Data Mining Algorithm:
- Choose a specific algorithm based on the selected technique.
- Consider factors like precision, understandability, and parameter settings.
- Utilizing the Data Mining Algorithm:
- Implement the chosen algorithm.
- Iterate as needed by adjusting control parameters.
- Evaluation:
- Assess and interpret mined patterns and rules.
- Consider the impact of preprocessing steps on results.
- Using the Discovered Knowledge:
- Incorporate knowledge into systems for action.
- Measure the effectiveness of changes made based on the discovered knowledge.
- Address challenges in applying knowledge to dynamic real-world conditions.
(c) What is Market basket analysis?
Market Basket Analysis (MBA) is a data mining technique used in the field of retail and marketing to uncover associations between products that are frequently purchased together. The fundamental idea behind market basket analysis is to identify patterns of co-occurrence in customer transactions and discover relationships between items.
Key concepts in Market Basket Analysis include:
- Association Rules:
- The primary output of market basket analysis is the discovery of association rules. These rules express relationships between products based on the likelihood that they will be purchased together. A common representation of an association rule is “If A, then B,” where A and B are items.
- Support:
- Support is a measure of how frequently a set of items appears together in the transactions. It is calculated as the number of transactions containing the items divided by the total number of transactions. High support indicates a strong association.
- Confidence:
- Confidence measures the reliability of the association rule. It is calculated as the number of transactions containing both items A and B divided by the number of transactions containing item A. High confidence indicates that when item A is purchased, there is a high probability that item B will also be purchased.
- Lift:
- Lift is a measure of how much more likely item B is to be purchased when item A is purchased, compared to when item B is purchased independently of item A. A lift greater than 1 indicates a positive correlation, suggesting a likely association.
Example: Consider a supermarket transaction dataset:
Transaction  Items
1            {Bread, Milk}
2            {Bread, Diapers, Beer}
3            {Milk, Diapers, Cola}
4            {Bread, Milk, Diapers, Beer}
5            {Bread, Milk, Cola}
Association rules that might be discovered include:
- {Bread} => {Milk} with high support and confidence.
- {Diapers, Beer} => {Bread} with moderate support and confidence.
- {Cola} => {Milk} with low support and confidence.
These rules can provide insights for retailers in terms of product placement, marketing strategies, and recommendations to increase sales. For instance, if a supermarket knows that bread and milk are frequently purchased together, they might place these items closer to each other to encourage additional purchases.
(d) Explain with example confusion matrix, accuracy and precision .
Confusion Matrix:
Consider a binary classification problem where we aim to predict whether an email is spam or not spam. The confusion matrix for this scenario is structured as follows:
                     | Predicted Not Spam | Predicted Spam |
---------------------|---------------------|-----------------|
Actual Not Spam      |        TN           |        FP       |
---------------------|---------------------|-----------------|
Actual Spam          |        FN           |        TP       |
Here:
- TN (True Negative): Emails correctly predicted as not spam.
- FP (False Positive): Emails incorrectly predicted as spam (Type I error).
- FN (False Negative): Emails incorrectly predicted as not spam (Type II error).
- TP (True Positive): Emails correctly predicted as spam.
Accuracy:
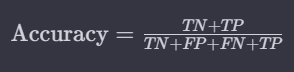
Accuracy measures the overall correctness of the model, providing the ratio of correctly predicted instances to the total instances.
Precision:
Precision gauges the accuracy of positive predictions, answering the question: Of the instances predicted as positive, how many are truly positive?
Recall (Sensitivity or True Positive Rate):

Recall assesses the model’s ability to capture all positive instances, answering: Of all actual positive instances, how many were predicted correctly?
F1 Score:

The F1 score, being the harmonic mean of precision and recall, provides a balanced measure between the two metrics. These evaluation metrics collectively offer a comprehensive assessment of a model’s performance, crucial in scenarios with imbalanced classes.
Q. 2
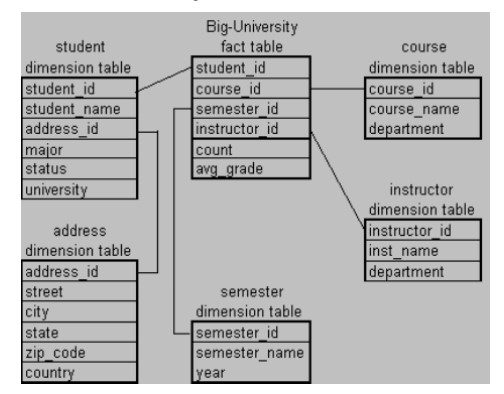
a) Suppose that a data warehouse for Big_University consists of the four dimensions Student, Course, Semester and Instructor, and two measures count and avg_grade, where count is the number of students and average grade is the course grade of the student.
Perform following tasks:
i. Design the star schema for the Big_University.
ii. Create a base cuboid for the Big_university database and apply different OLAP operations.
a) A Snowflake Shema is shown in figure below:
b) base cuboid [student, course, semester, instructor]
The specific OLAP operations to be performed:
1. Roll-up on course from course_id to department.
2. Roll-up on a student from student_id to university.
3. Dice on course, student with department =”CS” and university = “biguniversity”
4. Drill-down on a student from the university to student_name.