
Q.1 (A)(iv) The classification of persons based on blood groups is to be shown by a pie diagram. The persons having blood group O are 40%. What should be the measure of angle for the persons having O blood group ?
Statistics
Statistics
Every question from past board papers on Statistics, newest paper first. Open any question for its full worked answer.
Maharashtra SSC Algebra (Mathematics Part I) Board Paper June 2026
Full paper →-
-
Q.1 (B)(iv) Find Mean \((\bar{X})\) if \(\sum x_i f_i = 1265\) and \(\sum f_i = 50\).
-
Q.3 (B)(iii) Electricity used by some families is shown in the following table. Find the mode of electricity used.
Use of Electricity (Units) 0—20 20—40 40—60 60—80 80—100 100—120 No. of Families 13 50 70 100 80 17 -
Q.5 (ii) The following pie diagram represents the number of valid votes obtained by four students; who contested for school captain. The total of valid votes polled was 720.
[Pie diagram: Ram 100°, Raj 80°, Shubha 120°, Radha 60°]
Answer the following questions :
(a) Who has won the election ?
(b) What is the minimum number of votes ? Who got it ?
(c) By how many votes did the winner defeat the nearest contestant ?
Maharashtra SSC Algebra (Mathematics Part I) Board Paper March 2026
Full paper →-
Q.2 (B)(v) If \(\sum x_i f_i = 1265\) and \(N = 50\), then find the mean of the given data.
-
Q.4 (iii) The following table shows the funds collected by 105 students for flood affected people. Find the median of the data.
Fund (Rupees) No. of Students 10—20 10 20—30 37 30—40 15 40—50 20 50—60 7 60—70 8 70—80 8 -
Q.5 (i) A survey was conducted in the school. Student using different modes of transport is given below :
Mode of Transport Percentage of Students Bicycle 35 Bus \(a\) Railway \(2a\) Rickshaw 20 Find the value of \(a\) and draw the Pie diagram.
Maharashtra SSC Algebra (Mathematics Part I) Board Paper March 2025
Full paper →-
Q.2 (B)(v) The following table shows the number of students and the time they utilized daily for their studies. Find the mean time spent by the students for their studies.
Class Time (In hours) Class Marks (xi) No. of Students (fi) fixi 0–2 1 8 08 2–4 3 14 42 4–6 5 18 90 6–8 7 10 70 8–10 9 10 90 -
Q.3 (B)(iv) In a general store the prices of different articles and its demand is shown in the following frequency distribution table. Find the Median of the prices.
Price in Rupees No. of Articles Less than 20 140 20—40 100 40—60 80 60—80 60 80—100 20 -
Q.4 (iii) The following table shows the marks of 180 students in Mathematics.
Marks No. of Students 0—10 25 10—20 x 20—30 30 30—40 2x 40—50 65 Find the value of ‘x’ and draw histogram.
-
Q.5 (ii) The following pie-diagram shows percentage of persons according to blood group in a blood group checking camp. Answer the following questions :
[Pie diagram: O – 45%, B – 30%, A – 20%, AB – 5%]
(a) Find the measure of central angle for each blood group.
(b) Find the total number of persons, if there are 600 persons of blood group B.
Maharashtra SSC Algebra (Mathematics Part I) Board Paper July 2025
Full paper →-
Q.1 (B)(iv) Find the class mark of the class 6–10.
-
Q.2 (A)(iii) The monthly expenditure of a family on different items is shown in the following table. Complete the following activity to calculate the related central angles.
Activity :
Different items Percentage of expenditure Measure of central angle Food 40 \(\dfrac{40}{100} \times 360^\circ =\) ____ \(^\circ\) Clothing 20 \(\dfrac{20}{100} \times 360^\circ =\) ____ \(^\circ\) Education 30 \(\dfrac{30}{100} \times 360^\circ =\) ____ \(^\circ\) Other expenditure 10 \(\dfrac{10}{100} \times 360^\circ =\) ____ \(^\circ\) Total 100 360° -
Q.2 (B)(v) If \(\sum f_i d_i = 10,000\), \(\sum f_i = 100\) and \(A = 2000\), then find mean \((\bar{x})\).
-
Q.4 (iii) In the following frequency distribution table ages of 300 patients and number of patients in a hospital is given. Find the median age of the patients :
Age (In years) Number of patients 10–20 60 20–30 42 30–40 55 40–50 70 50–60 53 60–70 20
Maharashtra SSC Algebra (Mathematics Part I) Board Paper July 2024
Full paper →-
Q.3 (B)(iv) In the following table, the toll (in Rs.) paid from 6 am to 6 pm by drivers and the number of vehicles is shown. Find the mean of the toll by ‘assumed mean’ method.
Toll (Rs.) No. of Vehicles 300—400 80 400—500 110 500—600 120 600—700 70 700—800 40 -
Q.4 (iii) In one group of students; 10% students got 0 to 20 marks; 20% students got 20 to 40 marks; 35% students got 40 to 60 marks; 20% students got 60 to 80 marks and remaining 30 students got 80 to 100 marks, then :
(a) Prepare a grouped frequency distribution table.
(b) Find the mode of the marks scored.
Maharashtra SSC Algebra (Mathematics Part I) Board Paper March 2024
Full paper →-
Q.2 (B)(v) The following table shows classification of number of workers and number of hours they work in software company. Prepare less than upper limit type cumulative frequency distribution table :
Number of hours daily Number of workers 8–10 150 10–12 500 12–14 300 14–16 50 -
Q.3 (A)(i) The following frequency distribution table shows the classification of the number of vehicles and the volume of petrol filled in them. To find the mode of the volume of petrol filled, complete the following activity :
Class (Petrol filled in Liters) Frequency (Number of Vehicles) 0.5–3.5 33 3.5–6.5 40 6.5–9.5 27 9.5–12.5 18 12.5–15.5 12 Activity :
From the given table,
Modal class = ____
\(\therefore\) Mode = ____ \(+ \left[ \dfrac{f_1 - f_0}{2f_1 - f_0 -}\) ____ \(\right] \times h\)
\(\therefore\) Mode = 3.5 \(+ \left[ \dfrac{40 - 33}{2(40) - 33 - 27} \right] \times\) ____
\(\therefore\) Mode = 3.5 \(+ \left[ \dfrac{7}{80 - 60} \right] \times 3\)
\(\therefore\) Mode = ____
\(\therefore\) The mode of the volume of petrol filled is ____.
-
Q.5 (i) In the given figure, the pie diagram represents the amount spent on different sports by a school administration in a year. If the money spent on football is ₹ 9,000, answer the following questions :
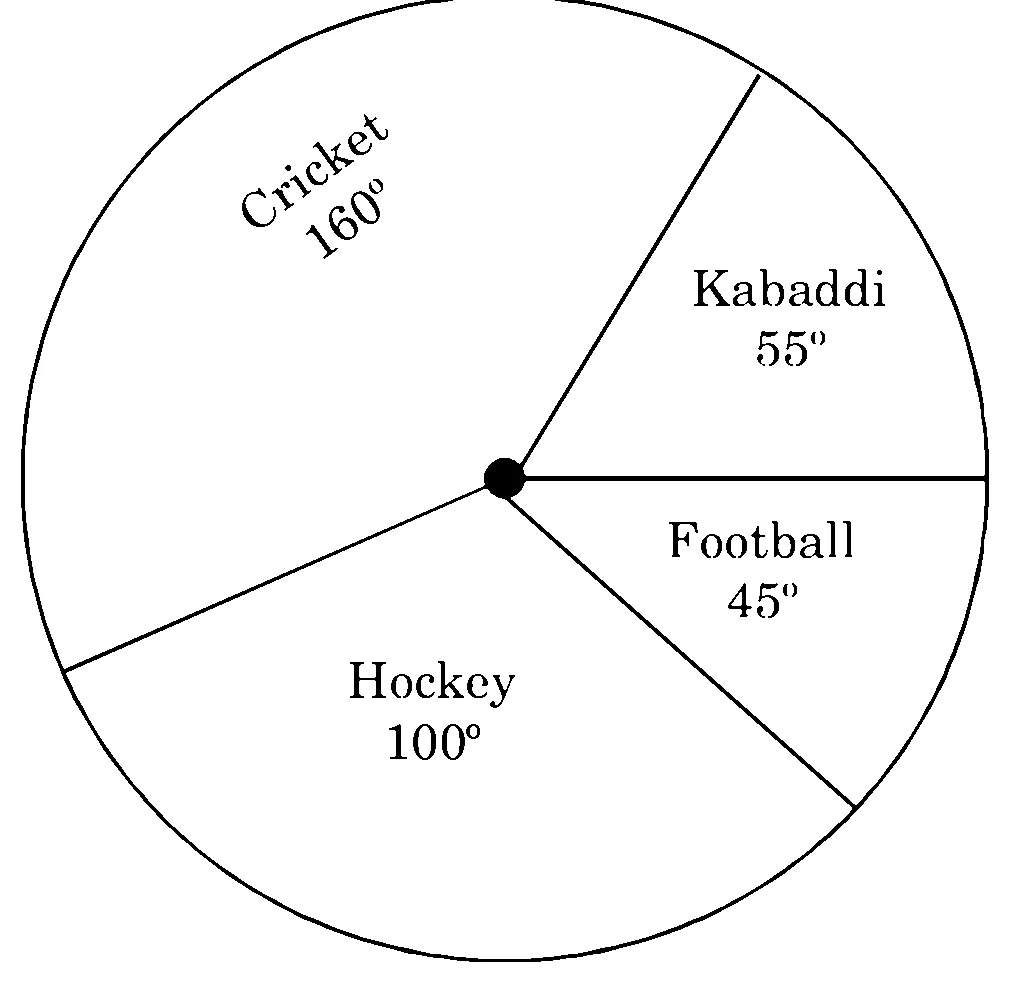
(a) What is the total amount spent on sports ?
(b) What is the amount spent on cricket ?